Skip to content
  • 0 Votes
    1 Posts
    35 Views
    A
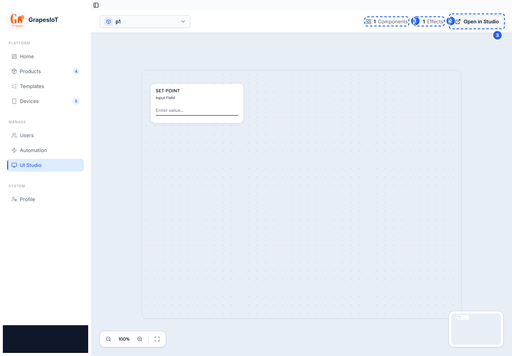
    Your First Dashboard in UI Studio UI Studio turns a product's data points into a mobile-style dashboard. No app build, no separate frontend project: you arrange widgets on a canvas, bind them to data points, and publish. This guide builds a small greenhouse screen with three values and one control. [image: 1794556172630-01-screens.png] The UI Studio workspace previews a product dashboard and opens the full editor in a new tab. Before you start You need: a product with data points, at least one device assigned to that product, the device online or publishing (so you can see values move). If you have not published a message yet, do the Quickstart: Device β†’ MQTT β†’ Live Monitor first. A dashboard with no data is hard to debug. 1. Open the studio There are two entry points: From a product card: click UI Studio. This opens the studio for that product in a new tab. From the sidebar: open UI Studio, pick the product, then click Open in Studio. The product-card route is the fastest way to start from scratch. The sidebar workspace shows the current dashboard and its component and effect counts. 2. Know the three areas The studio has three working areas: Palette on the left: the widgets you can add. Canvas in the middle: a mobile-style surface at a fixed design width. Property panel on the right: the selected widget's settings. [image: 1794556173761-03-widget-palette.png] The palette groups widgets by job: controls, charts, UI basics, controllers, and effects. The palette groups widgets by job. You will use these groups most often: CONTROL β€” toggles, sliders, input fields. CHARTS β€” line graphs and other history views. UI BASICS β€” text, meters, icons, shapes, colour pickers. CONTROLERS β€” scroll pickers, steppers, function sliders. EFFECTS β€” motion and other visual effects. The exact list depends on your build. If a widget is missing, it may be a newer widget that is not enabled for your account. 3. Add widgets Drag a widget from the palette onto the canvas, or click it to add it at a default position. For the greenhouse screen: Area Widget Bound data point Top Text none (title) Row 1 Value / Status temp Row 1 Value / Status humidity Row 2 Line Graph temp (history) Row 3 Toggle Switch pump Keep the canvas focused. A dashboard that shows everything is harder to use than one that answers a single question. [image: 1794556173188-02-canvas.png] The canvas is a mobile-style surface. Drag widgets from the palette, resize them, and bind each one to a data point. 4. Style and layout Select a widget to open the property panel. The tabs are: Tab What it controls STYLE Colors, typography, borders, backgrounds LAYOUT Position, size, alignment, spacing LOGIC Data binding and behaviour EFFECTS State-based visual changes [image: 1794556174353-04-property-panel.png] Select a widget to edit its style, layout, logic and effects. Logic is where data binding lives. Use LAYOUT to align widgets to a grid. The canvas is mobile-first; keep touch targets large enough to tap and avoid placing controls at the very edge. 5. Bind data Open the LOGIC tab and find Data Binding. [image: 1794556174916-05-data-binding.png] Pick the device and data point in the Logic tab. The widget starts receiving live values as soon as the device publishes. Choose the device. Choose a data point. Confirm the widget supports that data point's type. Binding rules to remember: A Status point can be read by a display widget. A Control point can be written by a toggle, slider, or button. A Both point can be read and written. A numeric widget will not bind to a string point, and a boolean widget will not bind to a number. If the data point list is empty, the device may not be assigned to the product, or the product may not have compatible points. For a line chart, bind history. If the data point does not have Storage enabled, there is no history to draw; the chart will be empty even though the live value updates. 6. Add effects (optional) EFFECTS lets a widget change its appearance based on a value. Typical uses: turn a status tile red when temperature is above a threshold, change an icon when a pump is running, show a warning state when a battery is low. Effects are evaluated on the client from live values. They are not server-side automations. Use the Automation section if you need to trigger an action rather than change a visual. 7. Publish Click PUBLISH in the top bar. The current layout is frozen into a read-only screen. [image: 1794556175450-06-published.png] PUBLISH freezes the current layout into a read-only screen that the device monitor and mobile clients can consume. The published screen: appears in the UI list, can be opened in the studio for further editing, is what the device monitor renders, is read-only at runtime, so users cannot accidentally move widgets. Publishing does not deploy firmware and does not change the data model. It only snapshots the layout and bindings. 8. Verify with live data Open the device monitor and publish a message. Confirm: the connection pill reaches Live, each bound widget shows the expected value, the toggle writes a control message when tapped, the chart fills if history is enabled. If a value is stale, check the binding first, then the payload key. A typo in dpcode is the most common cause of an empty widget. A good first-screen checklist One clear purpose per screen. A title that says what the screen is for. The three or four values that matter most, not every value in the product. Controls that are visually distinct from read-only values. Large touch targets and consistent spacing. A test with real data before you publish to users. Common questions Can I reuse a screen across devices? Bindings are per widget. If devices share the same product and data point codes, you can copy the layout and change the device binding. Keep one screen per product family. Why is my chart empty? The data point probably has Storage disabled, or the device has not published enough history yet. Why can't I bind a control? The data point is probably Status only. Change it to Both or Control, or use a display widget instead. Does publishing affect the device? No. Publishing only snapshots the dashboard. It does not send anything to the device. Next Data Point Types Explained for choosing the right widget and direction. Quickstart: Device β†’ MQTT β†’ Live Monitor for getting values into the platform.
  • 0 Votes
    1 Posts
    22 Views
    A
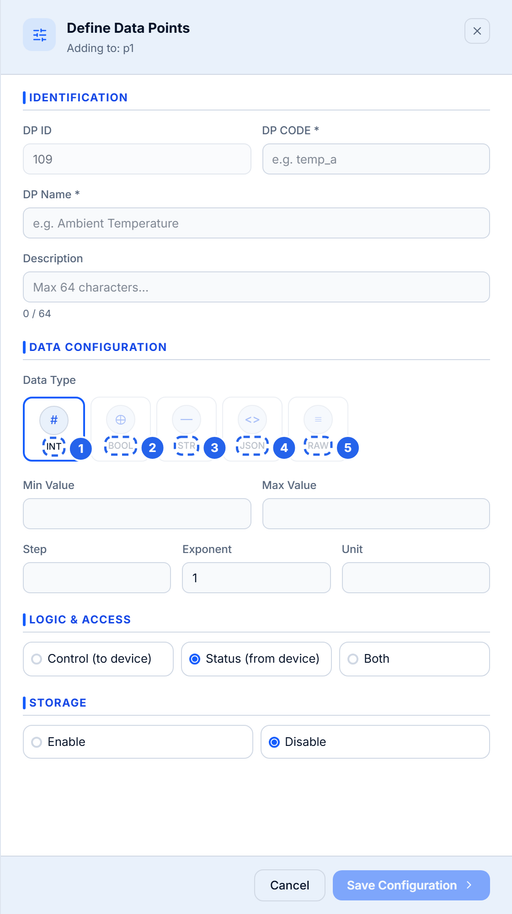
    Data Point Types Explained A data point type is not just a storage detail. It decides what the dashboard can render, what a control widget can write, and how the value is validated. This guide covers the types exposed by the current create panel, plus the two cases people ask about most: decimals and enum values. [image: 1794556169740-01-types.png] The create panel exposes INT, BOOL, STR, JSON and RAW. INT is the numeric type and accepts decimal values. The five top-level types Button Stored as Use it for Notes INT JSON number Temperature, humidity, voltage, counters The numeric type. Decimals are allowed even though the label says INT. BOOL Boolean Pump on/off, door open/closed, relay state Send real true / false, not "on" or 1. STR String Mode names, firmware version, short labels Set a max length. JSON Object with typed fields Schedules, config blobs, grouped telemetry Defined as named fields with their own types. RAW String Opaque vendor frames, hex payloads, pre-encoded data Stored as text; the platform does not interpret it. INT is the numeric type The create panel labels the numeric type INT, but the backend stores it as a number. That means 25.4 is a valid value. There is no separate FLOAT button in this build. If you need fractional values, use INT and set the unit, min, max, and step. When the widget prompts for a number, the step controls the increment. BOOL is strict A boolean data point expects true or false in the payload: { "pump": true } Sending "true", 1, or "on" may be accepted as a string by JSON but will not behave like a boolean in widgets and automations. Normalise the value in firmware before publishing. STR and RAW are not the same Both are stored as strings, but they signal different intent: STR is human-readable: "auto", "eco", "v1.4.2". Use it when the dashboard may display or select the value. RAW is opaque: a hex frame, a base64 blob, a vendor-specific payload. Use it when the platform should store and forward the value without interpreting it. If you want to display the value, prefer STR. If you want to preserve bytes, prefer RAW. JSON data points A JSON point is a small schema. Instead of one value, it contains named fields, each with its own type: [image: 1794556170216-02-json.png] JSON data points are defined as a set of named fields. Each field has its own type and optional default. { "schedule": { "start": "06:00", "duration_min": 15, "enabled": true, "mode": "auto" } } The JSON field editor lets you define each field's key, type, default value, and description. Supported field types are: bool number string enum Use JSON when the values belong together and you want one data point instead of five. Use separate top-level points when each value needs its own widget, history, or automation trigger. [image: 1794556170783-03-json-fields.png] Inside a JSON point you can mix bool, number, string and enum fields. The key is what your device publishes. Enum fields Enum is available as a field type inside JSON and as a binding type in widgets. It maps a stored value to a human label: Key Label auto Automatic eco Eco manual Manual This is the right choice for mode selectors and state machines. A top-level ENUM type is reserved in the schema and supported by some widgets, but the current create panel does not expose it as a top-level button. If you need named states today, use a JSON field with type Enum, or a STR with a documented set of values. Direction is part of the type decision The type says what the value is. The direction says who owns it. [image: 1794556171268-04-direction.png] Direction decides who owns the value: Control means the dashboard writes it, Status means the device reports it. Direction Meaning Typical examples Status (from device) Device reports; dashboard reads Temperature, humidity, battery Control (to device) Dashboard or automation writes; device obeys Pump, target temperature, mode Both Device reports and dashboard can write Setpoint echoed by the device Choose direction before you deploy. A control widget cannot bind to a status-only point, and changing direction later can invalidate existing bindings. Storage and history Storage is separate from type. A point can be live-only or stored: Live-only: the current value is available to monitors and widgets, but no history is kept. Stored: history is written for charts, exports, and audits. High-rate telemetry is often live-only. Daily totals, alarm states, and setpoints are usually stored. Naming rules The identifier is the key your device publishes, so keep it stable and boring. Must start with a letter. Lowercase letters, numbers, and underscores only. Maximum 16 characters. Must be unique within the product. Name: maximum 32 characters. Description: maximum 64 characters. Good: temp, humidity, pump_state, battery_v. Avoid: Temp, pump-state, temperature_sensor_1, t. Choosing a type: quick guide If you are measuring... Use A number, including decimals INT An on/off state BOOL A short label or mode name STR A group of related values JSON An opaque frame or blob RAW A named state inside a group JSON field with type Enum Common mistakes Sending a string for a numeric point. "25.4" is not 25.4. Cast in firmware. Using BOOL for a multi-state value. A pump is boolean; a mode with three values is not. Using five top-level points for one config blob. Use JSON when the values are always updated together. Using JSON when each value needs history. History and widgets are easier with separate points. Renaming a code after devices are deployed. Add a new point instead. Next Quickstart: Device β†’ MQTT β†’ Live Monitor for a working publisher. Your First Dashboard in UI Studio for binding each type to the right widget.
  • 0 Votes
    1 Posts
    34 Views
    A
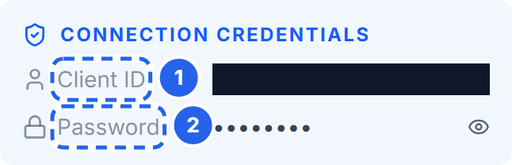
    Quickstart: Device β†’ MQTT β†’ Live Monitor This is the shortest path from a terminal to a live value in GrapesIoT. You need: a product with at least one data point, a device assigned to that product, the device's MQTT credentials, a machine with Node.js 18+ (for the sample publisher). [image: 1794556167890-01-credentials.png] Each device gets a unique client ID (also the MQTT username) and password. Treat the password like a secret. 1. Collect the connection details Open Devices and find the device card. Setting Where to find it Notes Broker URL This guide mqtt://dev.grapesiot.com:1883 Device ID Device route / device record Used in the topic MQTT username Device card β†’ Client ID Usually the same as the device ID MQTT password Device card β†’ Password Secret; do not commit it Topic Built from the device ID 1v0/<DEVICE_ID>/uplink If your deployment uses a different broker, use that host and port. The public broker above is for the hosted test environment; production deployments should use TLS and your own hostname. 2. Understand the envelope Every uplink is a JSON object with four required fields: { "type": 0, "stype": 0, "data": { "temp": 25.4, "humidity": 60, "pump": true }, "dir": 49 } Field Value Meaning type 0 DATA packet stype 0 Device-native sensor reading data object dpcode: value pairs dir 49 Required direction field. For DATA, the server requires it to be present; it does not use it to route the reading. Rules that matter: data keys must exactly match the product's data point codes. data can contain one key or many. Unrecognised keys are ignored, so a typo looks like β€œnothing happened”. The payload must be smaller than 4,100 bytes. Do not use dpid in the payload. Use dpcode. 3. Publish with Node.js Create a scratch folder and install the MQTT client: mkdir grapes-mqtt-test cd grapes-mqtt-test npm init -y npm install mqtt Create publish.mjs: import mqtt from 'mqtt' const BROKER_URL = process.env.MQTT_URL ?? 'mqtt://dev.grapesiot.com:1883' const DEVICE_ID = process.env.DEVICE_ID const MQTT_USERNAME = process.env.MQTT_USERNAME ?? DEVICE_ID const MQTT_PASSWORD = process.env.MQTT_PASSWORD if (!DEVICE_ID || !MQTT_PASSWORD) { console.error('Set DEVICE_ID and MQTT_PASSWORD first.') process.exit(1) } const topic = `1v0/${DEVICE_ID}/uplink` const payload = { type: 0, stype: 0, data: { temp: 25.4, humidity: 60, pump: true, }, dir: 49, } const client = mqtt.connect(BROKER_URL, { username: MQTT_USERNAME, password: MQTT_PASSWORD, clientId: MQTT_USERNAME, clean: true, reconnectPeriod: 0, }) client.on('connect', () => { console.log('connected to', BROKER_URL) client.publish(topic, JSON.stringify(payload), { qos: 1 }, (err) => { if (err) console.error('publish failed:', err) else console.log('published to', topic) client.end() }) }) client.on('error', (err) => { console.error('connection error:', err.message) client.end() }) Run it: $env:DEVICE_ID="<your-device-id>" $env:MQTT_USERNAME="<client-id>" $env:MQTT_PASSWORD="<device-password>" node publish.mjs On macOS or Linux: DEVICE_ID="<your-device-id>" \ MQTT_USERNAME="<client-id>" \ MQTT_PASSWORD="<device-password>" \ node publish.mjs A successful run prints: connected to mqtt://dev.grapesiot.com:1883 published to 1v0/<device-id>/uplink 4. Verify in the monitor Open the device and click Monitor Device. The connection pill should move to Live and any widgets bound to temp, humidity, or pump should update. [image: 1794556168434-02-monitor-live.png] When the payload reaches the broker, the monitor switches to Live and the bound widgets update. If the pill is live but a widget does not change, the message reached the device but the widget is not bound to the data point you published. Check the binding in UI Studio. 5. What the server does with the message Authenticates the MQTT client with the device credentials. Parses the JSON envelope and requires type, stype, data, and dir. Matches each data key to a data point code in the device's product. Updates the device's live state. Writes history if the data point has Storage enabled. Pushes the update to connected monitors over WebSocket. That is why a wrong dpcode can look like a successful publish: the broker accepted it, but the platform had nothing to update. Troubleshooting Symptom Likely cause Fix Connection refused or Not authorized Wrong host/port, client ID, or password Re-copy the credentials; check the broker URL Publish succeeds, monitor stays Not connected Wrong device ID in the topic Use the device UUID, not the product name Monitor is Live, widget does not move Widget not bound, or wrong dpcode Check the Logic tab binding and the payload key Values look like strings Type mismatch Send numbers for INT, booleans for BOOL payload too large Payload over 4,100 bytes Send fewer fields or split the message Security notes Never commit the device password. Use environment variables or a local .env file that is git-ignored. Mask credentials before posting screenshots. Use TLS and a private broker for production. The test broker in this guide is for getting started only. Rotate a device password immediately if it is exposed. Next Data Point Types Explained for choosing the right type and direction. Your First Dashboard in UI Studio for binding the values you just published. Protocol overview: https://embiq.grapesiot.com/protocol
  • 0 Votes
    1 Posts
    24 Views
    A
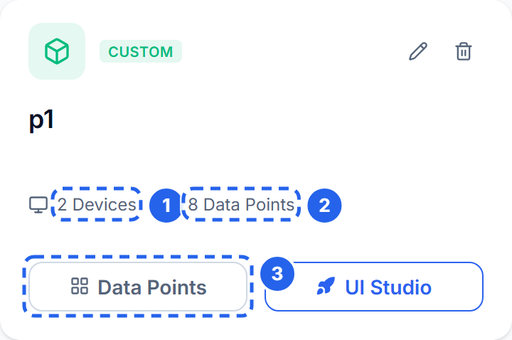
    How GrapesIoT Models Your Fleet Most first-week confusion comes from one question: what is the difference between a product, a data point, and a device? They are three layers of the same contract. Product β†’ what kind of thing am I? Data point β†’ what values does it expose? Device β†’ which physical unit is talking right now? Get those three right and everything else β€” MQTT, dashboards, history, automation β€” follows naturally. [image: 1794556164826-01-products.png] A product is the template. The card summarises how many devices use it and how many data points it defines. Product: the schema, not the hardware A product is a template for a class of device. It is not a physical unit and it does not connect to the broker by itself. A product holds: a name, description, and icon, the list of data points that every device of this type must expose, product-level metadata used by the UI and by templates. Think of it as the firmware interface description. If you are building a greenhouse controller, the product might be Greenhouse Controller v1. Every greenhouse controller you ship uses that same product, so every dashboard, alert, and history query works the same way. Create one product per hardware family. Do not create a product per unit. If two units differ only by serial number, they are devices of the same product. Data point: one named value in the contract A data point is one value the product exposes. It has: Field Purpose Example Name Human label Ambient Temperature Identifier (code) Machine key used in payloads temp Data type How the value is interpreted INT / BOOL / STR / JSON / RAW Direction Who writes the value Status / Control / Both Unit Display suffix Β°C Min / max / step Validation and widget bounds 0 / 60 / 0.1 Storage Whether history is retained on / off Two rules matter more than the rest: The identifier (dpcode) is the key your device publishes. It is not the numeric data point ID. The data type and direction are part of the contract. A dashboard widget that needs a boolean will not bind to a string point, and a control widget will not write to a status-only point. The product detail page lists every data point and shows the code, type, unit, and direction in one table. [image: 1794556165628-02-data-points.png] Data points define what a device can report or accept. The identifier becomes the key you publish in MQTT. Direction: status, control, or both Status (from device): the device reports it. Temperature, humidity, battery voltage, fault code. Control (to device): the dashboard or an automation writes it. Pump on/off, target temperature, mode selector. Both: the value can be reported and written. Use this for things like a setpoint that the device also echoes back. Direction is enforced by the UI and by the binding rules. If a widget cannot see a data point, check the direction before you check the network. Storage: live vs history A data point is live by default. Enable Storage when you need history for charts, exports, or audits. Storage is a per-data-point decision, so you can keep high-rate telemetry live-only and still retain daily totals. Device: one physical unit A device is one unit of a product. It has: a device UUID (used in the MQTT topic), a client ID / MQTT username and password, an optional owner assignment, a live connection state, a monitor view that renders the product's dashboard with real values. When you create a device, assign it to the product. The device then inherits the product's data point schema. If you add a data point later, every device of that product sees it; no per-device schema migration is needed. [image: 1794556166110-03-devices.png] A device is one physical unit. It inherits the product schema and gets its own MQTT client ID and password. Device ID vs client ID They are related but used in different places: The device UUID identifies the device in the topic: 1v0/<DEVICE_ID>/uplink. The client ID shown on the device card is the MQTT username. In the standard provisioning flow it is the same UUID. The password is generated with the device. It is a secret. If your account shows a client ID that differs from the device UUID, use the client ID as the MQTT username and the device UUID in the topic. The monitor is where the model becomes visible: the device's live state is rendered through the product's dashboard, using the bindings defined in UI Studio. [image: 1794556166654-04-monitor.png] The monitor is the runtime view: live values arrive over WebSocket as soon as the device publishes. A worked example Product: Greenhouse Controller v1 Code Name Type Direction Unit Storage temp Ambient Temperature INT Status Β°C on humidity Relative Humidity INT Status % on pump Pump State BOOL Both β€” off mode Operating Mode STR Both β€” off schedule Schedule JSON Both β€” off A device of this product publishes: { "type": 0, "stype": 0, "data": { "temp": 25.4, "humidity": 60, "pump": true }, "dir": 49 } The keys temp, humidity, and pump are the data point codes, not their numeric IDs. The server matches them to the product schema and updates the device's live state. The five mistakes to avoid Putting dpid in the payload. The payload uses dpcode. Numeric IDs are internal. Creating a product per unit. Create a product per hardware family, then add devices. Renaming a dpcode after deployment. It is a breaking change for every device and dashboard. Add a new point and migrate instead. Using a status-only point as a control. The widget will not bind, or the write will be rejected. Storing everything. High-rate telemetry can be live-only. Enable storage only where history is useful. What to read next Quickstart: Device β†’ MQTT β†’ Live Monitor for the exact topic, payload, credentials, and a runnable publisher. Data Point Types Explained for choosing the right type. Your First Dashboard in UI Studio for binding widgets to the data points you just defined.
  • 0 Votes
    1 Posts
    20 Views
    A
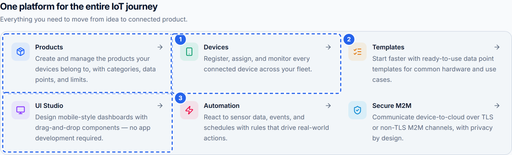
    Welcome to the GrapesIoT Platform This is the entry point for everything related to the GrapesIoT platform: products, devices, data points, dashboards, MQTT connectivity, and the tools that connect them. If you are new, read this post first. It gives you the mental model and points to the deeper guides in the series. [image: 1794556122861-01-capabilities.png] Products, devices, templates, dashboards, automation and secure M2M all live in one place. What the platform does GrapesIoT is built around one idea: describe your hardware once, then manage every unit of it as a device. That description lives in a product. A product defines: the identity of the thing you are building, the data points it exposes (temperature, humidity, pump state, battery voltage, and so on), the rules for each data point: type, direction, limits, units, and whether history is stored. A device is one physical unit of that product. It inherits the product schema, gets its own credentials, and starts publishing data. The same product can back one prototype or ten thousand field units without changing the dashboard or the data model. [image: 1794556123526-02-editions.png] Community Edition is free for up to three devices. Higher editions add production tooling and support. The four objects to learn first Object What it is Why it matters Product A template for a class of device Defines the data contract once Data point One named value in that contract Becomes the key your device publishes Device One physical unit Owns credentials and live state UI screen A published dashboard Turns live values into something people can use The relationships are simple: Product └── Data points (schema) └── Device (one unit, own credentials) └── Live values + history └── UI Studio dashboard Your first 15 minutes Create a product. Give it a name, and add two or three data points. Start with a status value such as temp and a control value such as pump. Create a device. Assign it to the product. Copy the client ID and password from the device card. Publish one message. Connect to the broker and send a JSON payload to 1v0/<DEVICE_ID>/uplink. Watch it arrive. Open the device monitor. The connection pill should move to Live and any bound widgets should update. Build a screen. Open UI Studio, drop a widget on the canvas, bind it to a data point, and publish. If you only have time for one step today, do step 3. Nothing in the platform feels real until a message from your hardware appears on screen. Community Edition limits The free Community Edition is intended for learning and prototyping. In the current app it allows: up to 3 devices up to 5 products Limits can change. Check the edition comparison on the home page and your account page before you plan a production rollout. If you need more, the Developer Edition and Custom Deployment options are listed on the home page. The rest of the series How GrapesIoT Models Your Fleet: Products β†’ Data Points β†’ Devices β€” the object model in detail, with the mistakes that cause most first-week confusion. Quickstart: Device β†’ MQTT β†’ Live Monitor β€” the exact topic, payload, credentials, and a runnable Node.js publisher. Data Point Types Explained β€” how to choose between INT, BOOL, STR, JSON and RAW, and when to use JSON fields or enum values. Your First Dashboard in UI Studio β€” palette, canvas, data binding, and publishing. Before you post When asking for help, include: the product name and data point code, the exact MQTT topic you published to (mask the device ID if you prefer), the payload you sent, what the monitor showed (connection state and value), whether the data point is Status, Control, or Both. Do not post device passwords, API tokens, or full connection credentials. Mask them before attaching screenshots. Useful links Platform: Open the platform MQTT & Connectivity: Open MQTT & Connectivity Protocol overview: https://embiq.grapesiot.com/protocol
  • 0 Votes
    1 Posts
    191 Views
    A
    Curated by people who read them β€” not an algorithm. One book finished beats ten bookmarked. Reply with what a resource taught you, not just its name. Books (read in this order) Making Embedded Systems β€” Elecia White. The single best "how the job actually works" book: hardware/firmware boundary, interviews with working engineers, debugging war stories. Start here. Test-Driven Development for Embedded C β€” James Grenning. Writing firmware you can trust, with host-side tests running before hardware exists. Transforms how you structure C. The C Programming Language β€” Kernighan & Ritchie. Thin, dense, timeless. The language reference every embedded engineer should have worked through at least once. Official documentation (primary sources beat tutorials) ESP-IDF Programming Guide β€” the framework reference; read the peripheral and FreeRTOS sections for your chip, not random blogs first. ESP32 Technical Reference Manual β€” the 600-page truth about your silicon: registers, clock trees, and errata. Intimidating, indispensable. Sites & series All About Circuits β€” electronics fundamentals explained patiently, with a textbook-grade volume set free online. EEVblog β€” teardowns and rants that teach measurement technique and design scepticism by example. HiveMQ MQTT Essentials β€” the clearest free walkthrough of MQTT concepts, one idea per short article. A note on links: titles only, deliberately β€” search the current edition yourself so you never land on a stale mirror. Reply with your own recommendations and one line on what each taught you.
  • 0 Votes
    1 Posts
    101 Views
    A
    Buying parts in India is easy once you know where to look β€” and expensive when you don't. These are starting points the community actually uses. Reply with your own finds and corrections; prices and stock change constantly. Online stores Robu.in β€” broad catalogue, dev boards, sensors, modules, kits. Good first stop for project builds. Evelta β€” components and modules with dependable stock for repeat orders. Element14 / Mouser India β€” authorised distribution. When the part must be genuine (precision sensors, ICs for anything shippable), buy here and pay the premium knowingly. General marketplaces β€” fine for kits, tools, enclosures, and jellybean parts. Check seller ratings; expect clones. Offline markets (worth a pilgrimage) SP Road, Bengaluru β€” the classic mile of component shops; bargaining expected, testing before buying normal. Lamington Road, Mumbai β€” same energy on the west coast, strong on tools and test gear too. Chandni Chowk (Bhagirath Palace), Delhi β€” wholesale-scale, best when buying in quantity. Ritchie Street, Chennai β€” the south's equivalent for parts and instruments. Buying tips that save money and boards Clone dev boards are fine; clone sensors are a gamble. A generic ESP32 board works. A suspiciously cheap "BMP280" may be a relabelled different sensor with wrong calibration β€” buy sensors that matter from trustworthy sellers. No-name lithium cells and chargers are a safety issue, not a bargain. Buy branded cells with protection, and never charge unattended on a sketchy module. Bundle to beat shipping. A β‚Ή40 part with β‚Ή80 shipping hurts; keep a running BOM and order together. Keep the GST invoice. You'll want it for college reimbursements, company expenses, and warranty claims. Reply with shops you've personally ordered from β€” what arrived fast, what arrived wrong.
  • 0 Votes
    1 Posts
    86 Views
    A
    Two instruments solve the overwhelming majority of hardware mysteries. You don't need a lab β€” a basic multimeter and the cheapest scope (or logic analyser) you can borrow will do. Here's the 20% worth learning first. Multimeter: measure, don't guess Continuity beep finds broken wires, cold solder joints, and short circuits. Power off first β€” beeping a live circuit lies to you and risks the meter. DC volts on the rail, under load. A 3.3V rail that reads 3.28V idle and 2.9V when WiFi transmits is your random-reset culprit. Always measure while the device is doing the thing that fails. Current in series. Break the supply line and put the meter in the middle (correct jack, correct range, start high). Compare against expectations: tens of mA sleeping, hundreds transmitting. Way off in either direction is a clue. Resistance unpowered. Verify pull-ups are actually pulling, dividers divide, and nothing is shorted to ground. Never measure resistance on a powered board. Scope: see the signal in time Probe on Γ—10, compensated, ground clip short. A long ground lead turns every fast edge into ringing that isn't really there. Compensate the probe on the scope's test output once, then trust what you see. Trigger deliberately. Free-running waveforms are soup. Trigger on the edge you care about β€” the UART start bit, the PWM rising edge, the droop when the motor kicks β€” and the picture stabilises. UART debugging: set the timebase to see individual bits, measure one bit width, invert to get the baud (1 Γ· width). If transmit and receive disagree by even a few percent at high baud, you get framing garbage. PWM check: duty cycle and frequency straight off the scope, in seconds. "The motor hums but doesn't turn" is usually 0% or 100% duty, or a frequency the driver can't follow. What to capture when asking for help One screenshot per mystery: the rail during the failure (is it power?), the signal in question with trigger point and timebase visible, and the meter reading that surprised you. A scope shot with no volts/div or timebase shown helps nobody β€” include the settings. Post your captures with settings visible. Tag with oscilloscope, multimeter or debugging.
  • 0 Votes
    1 Posts
    104 Views
    A
    This category is our shared parts shelf: pinouts, wiring notes, and gotchas for components we all use. Copy this format for every new entry so the database stays searchable: Part: name + common module variant Supply: voltage range the module wants Interface: I2C / SPI / UART / 1-Wire / analog / proprietary ESP32 wiring: which pins, pull-ups needed, level shifting needed? Gotcha: the thing that wastes everyone's afternoon Datasheet: manufacturer link Seeded entries (add yours below) DHT22 (AM2302) β€” temp + humidity Supply 3.3–5V Β· proprietary single-wire protocol Β· any GPIO, 10k pull-up to VCC on the data line. Gotcha: max ~0.5 Hz sampling β€” poll it every 2 seconds minimum. Faster polling returns stale or checksum-failed reads, and the sensor's physics is minutes-scale anyway; don't chase transients with it. DS18B20 β€” temperature, 1-Wire Supply 3.0–5.5V Β· 1-Wire bus (many sensors, one pin) Β· 4.7k pull-up to VCC on the data line, mandatory. Gotcha: every sensor has a unique 64-bit address β€” scan the bus and hardcode addresses per unit. Parasite-power mode works but a dedicated VCC wire is far more reliable in the field. MPU6050 β€” accelerometer + gyro module Supply 3.3V (most modules include a regulator; do NOT feed 5V into VCC if the module is 3.3V-logic) Β· I2C, address 0x68 (AD0 low) or 0x69 (AD0 high) Β· SDA/SCL with 4.7k pull-ups to 3.3V. Gotcha: two of these on one bus need different AD0 levels. Raw readings need calibration offsets β€” sample at rest and subtract bias before trusting angles. HC-SR04 β€” ultrasonic distance Supply 5V Β· trigger (input) + echo (output) GPIO Β· echo idles low and pulses 5V β€” divide it down (e.g. 1k/2k) before it reaches a 3.3V ESP32 pin. Gotcha: minimum range ~2–3 cm, wide beam picks up nearby objects, and soft surfaces absorb the ping. Time out your pulse measurement or one missed echo hangs the loop. Reply with new parts in the format above. Corrections welcome β€” a wrong entry here costs someone a board.
  • 0 Votes
    1 Posts
    206 Views
    A
    Nobody can debug wiring from "I connected everything correctly but it doesn't work." Show this instead: A clear top-down photo β€” every wire visible, good light, no spaghetti hiding the pins. A sketch of the circuit β€” hand-drawn is fine: which pin goes where, where power enters, where ground returns. Part numbers and supply specs β€” exact sensor module, what powers it (USB? 5V adapter? battery?), and what the rail measures under load. The symptom with numbers β€” "reads 0", "reads 4095 constantly", "resets when the motor starts", plus what you already tried. The gotchas that solve most posts here No common ground. Two boards or a board + external supply without shared GND gives garbage or nothing. Tie grounds together, always. 5V into a 3.3V pin. A 5V sensor output (looking at you, HC-SR04 echo) into an ESP32 GPIO will damage it. Divide down or level-shift first. Missing pull-ups. I2C needs them (4.7k to 3.3V is the standard starting point); floating inputs read noise. Motors and relays on the logic supply. They droop and spike the rail β€” the MCU browns out and resets exactly when the motor starts. Separate supply (shared GND), bulk capacitance at the driver, and a flyback diode across relay coils and brushed motors. GPIO pins can't drive loads. A pin signals; it doesn't power. Relays, motors, and long LED strips switch through a transistor or MOSFET with its own supply β€” never straight off the pin. Decouple like you mean it. A capacitor close to every IC's supply pins eats the high-frequency noise that causes "random" glitches. Post the photo, the sketch, and the measured numbers. Tag with hardware, wiring or sensors.
  • πŸ“Ά Connectivity issue? Post like this

    MQTT & Connectivity mqtt wifi tls
    1
    0 Votes
    1 Posts
    118 Views
    A
    Connectivity bugs are config bugs until proven otherwise. Include this every time or expect it as the first reply: broker host + port, security mode (plain / TLS / mutual TLS), client ID, the exact topics you publish and subscribe to (credentials redacted), the client library + version, and the full connection return code or error string. Read the return code before posting Client libraries report why a connection failed β€” quote it exactly: Code / symptom Usual meaning First check Connection refused / failed Wrong host, port, or the broker is down Ping the host; confirm the port (1883 plain, 8883 TLS) is reachable Unauthorized / bad credentials Username, password, or token rejected Regenerate the token; check for expiry and typos Topic rejected ACL blocks that topic for this client Topic must match your device ID exactly, character for character TLS verify failed CA chain not trusted by the device Correct CA cert flashed; device clock synced (unsynced clock = invalid certs) TLS handshake timeout Too little free heap for crypto Need comfortable headroom β€” print free heap before connecting Connects, then drops in seconds Keepalive shorter than your loop, or same client ID connected twice One client ID per device, always; keepalive longer than your longest blocking task The TLS checklist (fixes most "worked on desktop" cases) Sync time first β€” certificates are time-bound. Flash the right CA certificate, and actually verify against it (no insecure-mode leftovers from testing). Mutual auth needs the client cert + key provisioned per device, not copied across the fleet. If WiFi connects but MQTT fails, suspect a blocked port or firewall before suspecting code. Stay connected, not just connected once Reconnect with backoff (don't hammer the broker every 500 ms forever), resubscribe after every reconnect, use LWT so the fleet knows you're gone, and buffer outbound readings locally during outages instead of dropping them. A device that connects once in the lab and never recovers in the field isn't done. Post the return code, your topics, and what the broker logs say. Tag with mqtt, wifi or tls.
  • 0 Votes
    1 Posts
    128 Views
    A
    Half of firmware debugging is how you ask. A good report gets you an answer in an hour; "it doesn't work" gets you silence. Use this format every time: What I'm trying to do: one sentence β€” the goal, not the method. What I tried: the steps, in order. "Changed the baud rate, added a delay, swapped cables." What happened: exact text, not paraphrase. Paste the panic dump, the serial output, the wrong value. My setup: board (ESP32 DevKitC? which revision), IDE + version, relevant library versions. Minimal code: the smallest snippet that reproduces it β€” 20 lines beats 500. Use code blocks, never screenshots of code. Serial output: pasted as text, from boot to failure. Decode your own crash first A Guru Meditation Error print is a gift β€” it tells you the exception cause, the guilty program counter, and a backtrace. The fastest path: rebuild the exact same binary with symbols, feed the addresses to the decoder, and read the function names. Nine times out of ten it lands on one of these: Stack overflow β€” a task with a 1 KB stack calling deep library functions, or a large array declared inside a function. Symptom: crash inside random-looking code, corrupted backtrace. Fix: grow the stack, move big buffers to static/global. Watchdog bite β€” a task that never blocks. Any loop without a delay or blocking call starves the idle task and the watchdog resets the chip. Fix: yield every iteration. Null / wild pointer β€” dereferencing a queue handle or object that was never created, or used after deletion. Symptom: LoadProhibited on an address near zero. Fix: check every create call's return before use. Shared state without protection β€” a variable touched from a task and an ISR (or two tasks) with no guard. Symptom: works for hours, then corrupts once. Fix: qualifier or guard, depending on who shares it. The five gotchas that solve most posts here ADC reads garbage with WiFi on β†’ use ADC1 pins, never ADC2 under WiFi. Board resets randomly on USB β†’ weak cable or port; measure the rail under load, try a shorter cable and a powered hub. Serial shows garbage β†’ monitor baud must match Serial.begin() exactly. "Worked yesterday" β†’ something changed: code, wiring, power source, library update. Figure out what, then bisect it. Timing drift under WiFi β†’ never use blocking delays for cadence; sample on a stable timebase. Post with the format above and tag with firmware, freertos or esp32.
  • 0 Votes
    1 Posts
    205 Views
    A
    A datasheet is the ground truth for every component you use. Guessing at voltage limits, timing requirements, or register values is how you fry a board or spend a week debugging something the datasheet would have told you in ten minutes. The skill isn't reading every page β€” it's knowing which pages matter, in what order. The structure of these documents is a skill of its own: β†’ How technical documents are structured Read in this order Absolute Maximum Ratings β€” what kills the part. 5V into a 3.3V GPIO is a gamble, not a spec. Electrical Characteristics β€” the voltages, currents and timings you actually design to. This is where requirements turn into numbers you can hold a design to: β†’ Extracting requirements and electrical limits Register map β€” the exact bit that enables the interrupt, sets the mode, or clears the flag. Timing diagrams β€” setup and hold, clock polarity, what the signal must look like on a scope. Register rows and timing plots are where firmware meets silicon: β†’ Register maps, timing and protocol details App note + errata β€” how the vendor says to use the part, and what they corrected after printing. A worked 60-second example You need to enable a sensor's data-ready interrupt. The register map shows INT_ENABLE at address 0x2D, bit 3, "write 1 to enable, cleared on read of STATUS". That one row tells you the address, the bitmask (1 << 3), the write semantics, and the clearing rule β€” four facts you'd otherwise discover by trial and error. Every peripheral bring-up is this loop: map row β†’ mask β†’ write β†’ verify by reading back. β†’ Hands-on intro to reading datasheets Start at Reading Datasheets and work through it in order. Post the part number, the page/section, and what confuses you. Tag with datasheets.
  • 0 Votes
    1 Posts
    99 Views
    A
    Most firmware projects hit a wall that only maths solves β€” a sensor reading too noisy to use, a frequency that must be detected, a filter that needs tuning, a calculation that loses precision on a microcontroller with no FPU. This post is the practical core: no academic DSP, just the techniques that come up with real sensors. Sample fast enough, or lie to yourself Nyquist: to represent bandwidth B you need fs > 2B; anything above fs/2 folds back as a phantom: f_alias = |f - k*fs|. Thermal logger at fs = 10 Hz with 60 Hz mains hum coupled into the wiring β†’ k=6 β†’ |60-60| = 0 Hz. Your "temperature drift" is mains hum pretending to be DC. 100 Hz sampler with 130 Hz motor PWM residue β†’ |130-100| = 30 Hz phantom. You chase a resonance that doesn't exist. The engineering rule (not the textbook 2x): sample at 5–10x the highest frequency you must resolve, so your filter has room to roll off. Averaging after aliasing can't help β€” the fold already happened at the sampling instant. Anti-alias in analog (RC before the ADC) or by oversampling-then-filtering at high fs. Smooth with the right tool Moving average (N): white noise drops by √N, lag β‰ˆ NΒ·T/2. General thermal and ADC cleanup (N = 16–64). Exponential (EMA): y += alpha*(x-y), O(1) RAM. Display smoothing and tight loops. Median (odd N): kills spikes (WiFi bursts, brush clicks), preserves edges. Put it before averaging in spiky environments. Oversample + decimate: 4x oversampling buys roughly 1 extra bit (16x β†’ +2 bits: sample 160 Hz, average 16, output 10 Hz). Needs real noise across 1 LSB to dither. Hysteresis/deadband: act only past Β±band. Stops relay and fan chatter around thresholds. β†’ Sampling and signal conditioning for industrial sensors Convert counts to units β€” with proof Two-point calibration: take two raw/reference pairs, fit T = aΒ·counts + b, then validate with a third point and record references, conditions, date, and stale-data behaviour (hold-last-good, never actuate on unvalidated samples). Sample on a stable timebase (millis() cadence with +=, not delay() drift under WiFi load). Takeaways: match the rate to the physics, filter in analog before digital, median-before-average for spikes, calibrate with numbers and an expiry date. Finish with Sampling, noise and calibration β€” the full treatment this primer is distilled from. Post your sensor, your rate, the filter you tried, and the numbers. Tag with signal-processing.
  • 0 Votes
    1 Posts
    99 Views
    A
    Knowing your threat model is half the job. This companion post is the other half: the concrete mechanisms that keep a deployed fleet trustworthy for years β€” identity, storage, boot integrity, and updates that can't brick everything at once. One device, one credential Fleet-wide passwords and hardcoded API keys are a supply-chain vulnerability β€” one leak compromises every unit ever shipped. Each device gets unique credentials issued at provisioning, with expiry and rotation planned from day one. Certificates beat passwords where the hardware allows it: a client certificate in protected storage is harder to phish, share, or guess than any string a human invents. β†’ Certificate-based auth and device tokens Secrets live in protected storage, not source code On-device credentials belong in NVS with proper access control plus a provisioning flow β€” never as string literals in firmware. Assume anyone can dump your flash; design so a dump alone isn't enough. Work through what happens when a unit is returned, resold, or stolen: wipe procedures and revocation lists are part of the design, not an afterthought. The general principle β€” shrink what the device exposes β€” applies far beyond storage: β†’ Credential storage on the device β†’ Device security: shrinking the attack surface Trust the code you run Secure boot stops modified firmware from executing on your hardware. β†’ The secure boot concept Signed OTA with hash verification stops tampered images from installing. Automatic rollback on failure stops one bad release from becoming a fleet-wide outage β€” an update path without rollback is a disaster waiting for a trigger. The full identity-to-update story, end to end: β†’ Secure OTA with signed firmware β†’ Identity, authorisation and secure updates What "passing review" looks like Unique per-device credentials (never hardcoded), TLS with proper certificate validation and clock sync, secure boot plus signed OTA with rollback, and a tested incident routine. That's the bar that separates professional firmware from hobbyist firmware. Finish with IoT security engineering β€” threat modelling to incident response in one track. Post what you've hardened, your provisioning flow, or your OTA rollback story. Tag with security.
  • πŸ”’ How IoT devices get owned

    IoT Security Concepts security tls firmware
    1
    0 Votes
    1 Posts
    82 Views
    A
    Insecure firmware has taken down chunks of the internet β€” hundreds of thousands of cameras, routers and DVRs running default credentials, herded into a botnet overnight. Similar flaws have reached into industrial plants. Your device ships into an adversarial network, so security is a set of decisions from the first line of firmware, not a feature added at the end. Think like an attacker first Ask four questions about your own device: what is valuable here (data? compute? a foothold into the LAN?), who wants it, how do they reach it (open ports? UART header? cloud API?), and what happens if they succeed? That threat model decides everything else β€” a soil sensor and a door lock do not deserve the same budget, and the model tells you where the budget goes. β†’ Threat modelling and security foundations The transport layer: where most devices fail open TLS with both sides proving identity. Server-only TLS leaves devices talking to impostors; mutual auth means the device verifies the server and the server verifies the device. Two field gotchas: actually validate the CA chain (skipping verification "temporarily" becomes permanent), and sync the clock first β€” certificates look invalid on a device that thinks it's 1970. β†’ Device-side practice: TLS auth and secure boot Network posture. Close what you don't use, assume the local network is hostile, and treat every byte arriving over the air as untrusted input until validated. Most Mirai-class compromises weren't exotic crypto breaks β€” they were default passwords on open remote-access ports. β†’ Network and communication security Continue with the IoT security deep track β€” identity, firmware and incident response. Post your device, your threat model, and where you think you're exposed. Tag with security or tls. For identity, secure boot and updates, see the companion post below.
  • πŸ”Œ REST + JSON in IoT projects

    REST APIs & JSON api json http
    1
    0 Votes
    1 Posts
    104 Views
    A
    Devices speak MQTT. Everything else β€” dashboards, scripts, platform config, phone apps β€” speaks REST and JSON. You'll meet this layer the moment a webhook never arrives, a platform call returns 403, or firmware chokes on a field that's suddenly null. Three stories you'll live through "It works in Postman but not on the device." Postman hides memory limits. On an ESP32, parsing a 4 KB JSON payload with the wrong strategy fragments the heap or blows the stack. Stream or bound your parsing, check every field's presence and type before use, and never assume a key exists because it did yesterday. The device side has its own rules β€” when to reach for REST over MQTT, how to keep the memory footprint flat: β†’ HTTP and REST from the device side "The API returns 403 and I don't know why." Almost always auth scope, an expired token, or a path that doesn't match your device ID exactly. Read the status code properly β€” 401 means prove who you are, 403 means you proved it and still can't, 429 means slow down β€” then reproduce with curl before touching firmware. The underlying principles are worth learning once, properly: β†’ HTTP and REST architectural principles β†’ Validation, errors and authentication "The payload shape keeps changing." Firmware v1 sends this: { "t": "v1", "temp": 27.4, "hum": 62.1 } Firmware v2 sends this: { "t": "v2", "temperature_c": 27.4, "humidity_rh": 62.1, "vbat_mv": 3910 } The dashboard breaks for half the fleet. Contracts matter: version your payloads (t or v on every message), accept missing optional fields with defaults, never crash on extra fields, and reject unknown major versions with a counted alert instead of silent garbage. Design the shape deliberately up front and this class of bug disappears: β†’ Resource modelling and API contracts Symptom β†’ what to learn Symptom What to learn 401/403 from a platform API Auth, tokens and scopes Payload too big or shape drifting Resource modelling and contracts Works on desktop, fails on ESP32 JSON parsing under RAM limits Start at REST API Development and work through it in order. Post the method + URL + status code + body (redact secrets), and what curl says. Tag with api or json.
  • 0 Votes
    1 Posts
    82 Views
    A
    One device sending telemetry every 5 seconds produces about 17,000 rows a day. A hundred devices produce 1.7 million rows a day β€” all timestamped, all needing fast answers for dashboards and alerts: average temperature per hour, last-seen per device, events inside a time window. This is where most IoT projects quietly succeed or fail, long after the firmware works. Start with Postgres, think in time Postgres handles millions to low billions of rows on ordinary hardware when the schema is narrow, indexed on (device_id, ts), and old data is dropped by time range. The discipline that makes it scale β€” and yes, this is a data-modelling problem first, which is why it helps to have the fundamentals straight: β†’ Database fundamentals: modelling and normalisation One time column to rule queries. Every analytical query bounds ts. Queries that filter on payload alone (WHERE temperature_c > 30, no time bound) are full-table scans at any scale β€” always add the time bound first. Narrow rows, typed columns. Keep hot fields relational. Unmodelled JSON accumulates five spellings of temperature and breaks every downstream query β€” and columnar compression works best on typed columns, not opaque JSON. Retention is a partition operation. Dropping whole time partitions by age runs in milliseconds; deleting a year row-by-row can stall a cluster for days. Design deletes by time range from day one. β†’ Native partitioning, compression thinking and retention Precompute the dashboards. An hourly rollup table turns a million-row dashboard scan into a 24-row lookup. Same GROUP BY date_trunc shape, precomputed β€” keep the bucket expression identical in raw and rollup form. β†’ Joins, aggregation and subqueries The Timescale upgrade path (concepts, no new queries) When the fleet grows, TimescaleDB automates exactly these patterns with zero query rewrites β€” because your queries already bound ts and group by (device_id, date_trunc): Hypertables auto-create time chunks behind a normal-looking table (create_hypertable on ts), with per-chunk indexing and pruning that behaves like your manual partitions. Compression on chunks older than N days (roughly 10x on narrow numeric telemetry) for cheap long retention. Continuous aggregates replace hand-maintained hourly tables with background materialisation. Retention policies (add_retention_policy, e.g. raw 90 days, rollups 2 years) replace the detach-and-drop routine. The rule from the field: earn the extension with growth numbers. A Timescale dependency for a million rows loses to a clean native design with pruning, two composite indexes, and a documented upgrade path. Finish with the telemetry schema capstone β€” a 500-sensor fleet designed and measured end to end. Post your schema, the slow query with its EXPLAIN, and the time range involved. Tag with database.
  • 0 Votes
    1 Posts
    85 Views
    A
    You don't need to become a sysadmin. You need the slice of Linux that unblocks firmware work: moving fast, reading logs, reaching a remote machine, and automating the boring flash-and-test loop. Recipes you'll use weekly Hunting through logs. A device prints thousands of lines and the one error matters. grep -i "error\|panic\|wdt" serial.log finds it; piping build output through a filter beats scrolling. Learn pipes and redirection once and every future debugging gets faster. β†’ Searching, transforming and inspecting data β†’ Shell basics and text processing Talking to serial from the terminal. screen /dev/ttyUSB0 115200 (or minicom) gets you a monitor without opening an IDE. When a port disappears after a reboot, knowing how to list devices and check permissions saves an hour of replugging cables. β†’ Permissions, users and processes Reaching remote machines. SSH into a build server or a gateway in the field, copy firmware over with scp, forward a port to see a remote dashboard locally. Most "the server is broken" moments are a wrong path, a dead service, or a full disk β€” all diagnosable over SSH. Automating the loop. Flashing ten boards by hand is how mistakes happen. A five-line shell loop that builds, flashes, and captures each board's first minute of logs turns a painful afternoon into a coffee break. β†’ Pipes, processes and automation Start at Linux Fundamentals for the OS side, then the command-line tools above for speed. Post your useful one-liners, serial-port recipes, SSH quirks, or WSL fixes. Tag with linux or terminal.
  • 0 Votes
    1 Posts
    86 Views
    A
    When a device fails in the field, the first question is: "what exact binary is on it, and can we rebuild it?" If your version control can't answer that, nothing else in your workflow matters. Checklist before you ask for help here Every shipped binary maps to a tag (git tag v1.2.3), not "final_final2". A tag is the only way to rebuild byte-identical firmware months later when a customer reports a bug on old hardware. β†’ Tags, releases and repository hygiene Build artefacts, secrets and calibration dumps are ignored. .pio/, build/, certificates, tokens and per-device calibration data never belong in history. Once a secret is committed, rotating it is the only fix β€” deleting the file later doesn't remove it from history. No credentials in the repo. Ever. Device tokens and WiFi passwords live in provisioning, environment, or a secrets store β€” not in a header file someone will push to GitHub. You can bisect back to the breakage. When a regression appears three weeks late, git bisect with small, honest commits finds the culprit in minutes. "Backup Friday" commits make that impossible. β†’ Advanced workflows and recovery Start at Git & Version Control and work through it in order. Share your workflows, ignore-file setups, or mistakes learned the hard way. Tag with git.