Skip to content

GrapesIoT Platform

4 Topics 4 Posts

Dashboard, alerts, fleet management, OTA, API, TimescaleDB, webhook

This category can be followed from the open social web via the handle grapesiot-platform@forum.grapesiot.com

  • 0 Votes
    1 Posts
    20 Views
    A
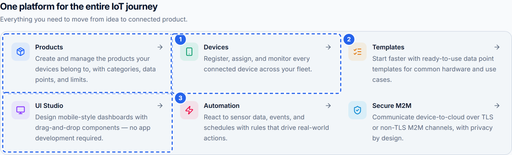
    Welcome to the GrapesIoT Platform This is the entry point for everything related to the GrapesIoT platform: products, devices, data points, dashboards, MQTT connectivity, and the tools that connect them. If you are new, read this post first. It gives you the mental model and points to the deeper guides in the series. [image: 1794556122861-01-capabilities.png] Products, devices, templates, dashboards, automation and secure M2M all live in one place. What the platform does GrapesIoT is built around one idea: describe your hardware once, then manage every unit of it as a device. That description lives in a product. A product defines: the identity of the thing you are building, the data points it exposes (temperature, humidity, pump state, battery voltage, and so on), the rules for each data point: type, direction, limits, units, and whether history is stored. A device is one physical unit of that product. It inherits the product schema, gets its own credentials, and starts publishing data. The same product can back one prototype or ten thousand field units without changing the dashboard or the data model. [image: 1794556123526-02-editions.png] Community Edition is free for up to three devices. Higher editions add production tooling and support. The four objects to learn first Object What it is Why it matters Product A template for a class of device Defines the data contract once Data point One named value in that contract Becomes the key your device publishes Device One physical unit Owns credentials and live state UI screen A published dashboard Turns live values into something people can use The relationships are simple: Product └── Data points (schema) └── Device (one unit, own credentials) └── Live values + history └── UI Studio dashboard Your first 15 minutes Create a product. Give it a name, and add two or three data points. Start with a status value such as temp and a control value such as pump. Create a device. Assign it to the product. Copy the client ID and password from the device card. Publish one message. Connect to the broker and send a JSON payload to 1v0/<DEVICE_ID>/uplink. Watch it arrive. Open the device monitor. The connection pill should move to Live and any bound widgets should update. Build a screen. Open UI Studio, drop a widget on the canvas, bind it to a data point, and publish. If you only have time for one step today, do step 3. Nothing in the platform feels real until a message from your hardware appears on screen. Community Edition limits The free Community Edition is intended for learning and prototyping. In the current app it allows: up to 3 devices up to 5 products Limits can change. Check the edition comparison on the home page and your account page before you plan a production rollout. If you need more, the Developer Edition and Custom Deployment options are listed on the home page. The rest of the series How GrapesIoT Models Your Fleet: Products → Data Points → Devices — the object model in detail, with the mistakes that cause most first-week confusion. Quickstart: Device → MQTT → Live Monitor — the exact topic, payload, credentials, and a runnable Node.js publisher. Data Point Types Explained — how to choose between INT, BOOL, STR, JSON and RAW, and when to use JSON fields or enum values. Your First Dashboard in UI Studio — palette, canvas, data binding, and publishing. Before you post When asking for help, include: the product name and data point code, the exact MQTT topic you published to (mask the device ID if you prefer), the payload you sent, what the monitor showed (connection state and value), whether the data point is Status, Control, or Both. Do not post device passwords, API tokens, or full connection credentials. Mask them before attaching screenshots. Useful links Platform: Open the platform MQTT & Connectivity: Open MQTT & Connectivity Protocol overview: https://embiq.grapesiot.com/protocol
  • 0 Votes
    1 Posts
    35 Views
    A
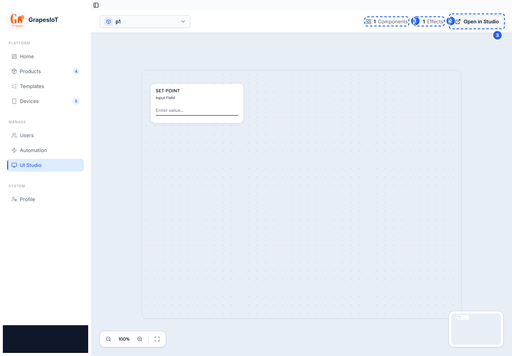
    Your First Dashboard in UI Studio UI Studio turns a product's data points into a mobile-style dashboard. No app build, no separate frontend project: you arrange widgets on a canvas, bind them to data points, and publish. This guide builds a small greenhouse screen with three values and one control. [image: 1794556172630-01-screens.png] The UI Studio workspace previews a product dashboard and opens the full editor in a new tab. Before you start You need: a product with data points, at least one device assigned to that product, the device online or publishing (so you can see values move). If you have not published a message yet, do the Quickstart: Device → MQTT → Live Monitor first. A dashboard with no data is hard to debug. 1. Open the studio There are two entry points: From a product card: click UI Studio. This opens the studio for that product in a new tab. From the sidebar: open UI Studio, pick the product, then click Open in Studio. The product-card route is the fastest way to start from scratch. The sidebar workspace shows the current dashboard and its component and effect counts. 2. Know the three areas The studio has three working areas: Palette on the left: the widgets you can add. Canvas in the middle: a mobile-style surface at a fixed design width. Property panel on the right: the selected widget's settings. [image: 1794556173761-03-widget-palette.png] The palette groups widgets by job: controls, charts, UI basics, controllers, and effects. The palette groups widgets by job. You will use these groups most often: CONTROL — toggles, sliders, input fields. CHARTS — line graphs and other history views. UI BASICS — text, meters, icons, shapes, colour pickers. CONTROLERS — scroll pickers, steppers, function sliders. EFFECTS — motion and other visual effects. The exact list depends on your build. If a widget is missing, it may be a newer widget that is not enabled for your account. 3. Add widgets Drag a widget from the palette onto the canvas, or click it to add it at a default position. For the greenhouse screen: Area Widget Bound data point Top Text none (title) Row 1 Value / Status temp Row 1 Value / Status humidity Row 2 Line Graph temp (history) Row 3 Toggle Switch pump Keep the canvas focused. A dashboard that shows everything is harder to use than one that answers a single question. [image: 1794556173188-02-canvas.png] The canvas is a mobile-style surface. Drag widgets from the palette, resize them, and bind each one to a data point. 4. Style and layout Select a widget to open the property panel. The tabs are: Tab What it controls STYLE Colors, typography, borders, backgrounds LAYOUT Position, size, alignment, spacing LOGIC Data binding and behaviour EFFECTS State-based visual changes [image: 1794556174353-04-property-panel.png] Select a widget to edit its style, layout, logic and effects. Logic is where data binding lives. Use LAYOUT to align widgets to a grid. The canvas is mobile-first; keep touch targets large enough to tap and avoid placing controls at the very edge. 5. Bind data Open the LOGIC tab and find Data Binding. [image: 1794556174916-05-data-binding.png] Pick the device and data point in the Logic tab. The widget starts receiving live values as soon as the device publishes. Choose the device. Choose a data point. Confirm the widget supports that data point's type. Binding rules to remember: A Status point can be read by a display widget. A Control point can be written by a toggle, slider, or button. A Both point can be read and written. A numeric widget will not bind to a string point, and a boolean widget will not bind to a number. If the data point list is empty, the device may not be assigned to the product, or the product may not have compatible points. For a line chart, bind history. If the data point does not have Storage enabled, there is no history to draw; the chart will be empty even though the live value updates. 6. Add effects (optional) EFFECTS lets a widget change its appearance based on a value. Typical uses: turn a status tile red when temperature is above a threshold, change an icon when a pump is running, show a warning state when a battery is low. Effects are evaluated on the client from live values. They are not server-side automations. Use the Automation section if you need to trigger an action rather than change a visual. 7. Publish Click PUBLISH in the top bar. The current layout is frozen into a read-only screen. [image: 1794556175450-06-published.png] PUBLISH freezes the current layout into a read-only screen that the device monitor and mobile clients can consume. The published screen: appears in the UI list, can be opened in the studio for further editing, is what the device monitor renders, is read-only at runtime, so users cannot accidentally move widgets. Publishing does not deploy firmware and does not change the data model. It only snapshots the layout and bindings. 8. Verify with live data Open the device monitor and publish a message. Confirm: the connection pill reaches Live, each bound widget shows the expected value, the toggle writes a control message when tapped, the chart fills if history is enabled. If a value is stale, check the binding first, then the payload key. A typo in dpcode is the most common cause of an empty widget. A good first-screen checklist One clear purpose per screen. A title that says what the screen is for. The three or four values that matter most, not every value in the product. Controls that are visually distinct from read-only values. Large touch targets and consistent spacing. A test with real data before you publish to users. Common questions Can I reuse a screen across devices? Bindings are per widget. If devices share the same product and data point codes, you can copy the layout and change the device binding. Keep one screen per product family. Why is my chart empty? The data point probably has Storage disabled, or the device has not published enough history yet. Why can't I bind a control? The data point is probably Status only. Change it to Both or Control, or use a display widget instead. Does publishing affect the device? No. Publishing only snapshots the dashboard. It does not send anything to the device. Next Data Point Types Explained for choosing the right widget and direction. Quickstart: Device → MQTT → Live Monitor for getting values into the platform.
  • 0 Votes
    1 Posts
    22 Views
    A
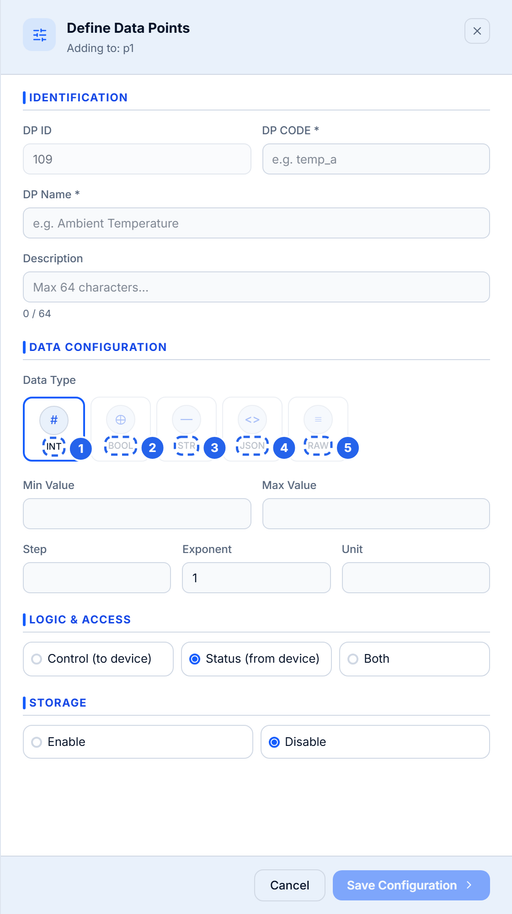
    Data Point Types Explained A data point type is not just a storage detail. It decides what the dashboard can render, what a control widget can write, and how the value is validated. This guide covers the types exposed by the current create panel, plus the two cases people ask about most: decimals and enum values. [image: 1794556169740-01-types.png] The create panel exposes INT, BOOL, STR, JSON and RAW. INT is the numeric type and accepts decimal values. The five top-level types Button Stored as Use it for Notes INT JSON number Temperature, humidity, voltage, counters The numeric type. Decimals are allowed even though the label says INT. BOOL Boolean Pump on/off, door open/closed, relay state Send real true / false, not "on" or 1. STR String Mode names, firmware version, short labels Set a max length. JSON Object with typed fields Schedules, config blobs, grouped telemetry Defined as named fields with their own types. RAW String Opaque vendor frames, hex payloads, pre-encoded data Stored as text; the platform does not interpret it. INT is the numeric type The create panel labels the numeric type INT, but the backend stores it as a number. That means 25.4 is a valid value. There is no separate FLOAT button in this build. If you need fractional values, use INT and set the unit, min, max, and step. When the widget prompts for a number, the step controls the increment. BOOL is strict A boolean data point expects true or false in the payload: { "pump": true } Sending "true", 1, or "on" may be accepted as a string by JSON but will not behave like a boolean in widgets and automations. Normalise the value in firmware before publishing. STR and RAW are not the same Both are stored as strings, but they signal different intent: STR is human-readable: "auto", "eco", "v1.4.2". Use it when the dashboard may display or select the value. RAW is opaque: a hex frame, a base64 blob, a vendor-specific payload. Use it when the platform should store and forward the value without interpreting it. If you want to display the value, prefer STR. If you want to preserve bytes, prefer RAW. JSON data points A JSON point is a small schema. Instead of one value, it contains named fields, each with its own type: [image: 1794556170216-02-json.png] JSON data points are defined as a set of named fields. Each field has its own type and optional default. { "schedule": { "start": "06:00", "duration_min": 15, "enabled": true, "mode": "auto" } } The JSON field editor lets you define each field's key, type, default value, and description. Supported field types are: bool number string enum Use JSON when the values belong together and you want one data point instead of five. Use separate top-level points when each value needs its own widget, history, or automation trigger. [image: 1794556170783-03-json-fields.png] Inside a JSON point you can mix bool, number, string and enum fields. The key is what your device publishes. Enum fields Enum is available as a field type inside JSON and as a binding type in widgets. It maps a stored value to a human label: Key Label auto Automatic eco Eco manual Manual This is the right choice for mode selectors and state machines. A top-level ENUM type is reserved in the schema and supported by some widgets, but the current create panel does not expose it as a top-level button. If you need named states today, use a JSON field with type Enum, or a STR with a documented set of values. Direction is part of the type decision The type says what the value is. The direction says who owns it. [image: 1794556171268-04-direction.png] Direction decides who owns the value: Control means the dashboard writes it, Status means the device reports it. Direction Meaning Typical examples Status (from device) Device reports; dashboard reads Temperature, humidity, battery Control (to device) Dashboard or automation writes; device obeys Pump, target temperature, mode Both Device reports and dashboard can write Setpoint echoed by the device Choose direction before you deploy. A control widget cannot bind to a status-only point, and changing direction later can invalidate existing bindings. Storage and history Storage is separate from type. A point can be live-only or stored: Live-only: the current value is available to monitors and widgets, but no history is kept. Stored: history is written for charts, exports, and audits. High-rate telemetry is often live-only. Daily totals, alarm states, and setpoints are usually stored. Naming rules The identifier is the key your device publishes, so keep it stable and boring. Must start with a letter. Lowercase letters, numbers, and underscores only. Maximum 16 characters. Must be unique within the product. Name: maximum 32 characters. Description: maximum 64 characters. Good: temp, humidity, pump_state, battery_v. Avoid: Temp, pump-state, temperature_sensor_1, t. Choosing a type: quick guide If you are measuring... Use A number, including decimals INT An on/off state BOOL A short label or mode name STR A group of related values JSON An opaque frame or blob RAW A named state inside a group JSON field with type Enum Common mistakes Sending a string for a numeric point. "25.4" is not 25.4. Cast in firmware. Using BOOL for a multi-state value. A pump is boolean; a mode with three values is not. Using five top-level points for one config blob. Use JSON when the values are always updated together. Using JSON when each value needs history. History and widgets are easier with separate points. Renaming a code after devices are deployed. Add a new point instead. Next Quickstart: Device → MQTT → Live Monitor for a working publisher. Your First Dashboard in UI Studio for binding each type to the right widget.
  • 0 Votes
    1 Posts
    24 Views
    A
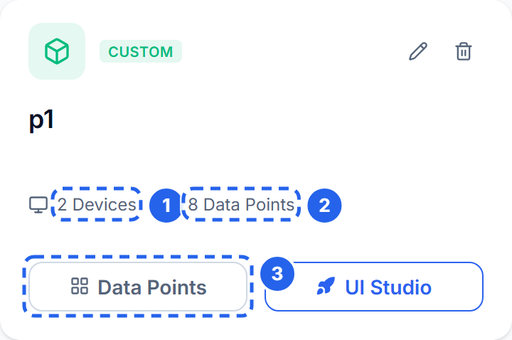
    How GrapesIoT Models Your Fleet Most first-week confusion comes from one question: what is the difference between a product, a data point, and a device? They are three layers of the same contract. Product → what kind of thing am I? Data point → what values does it expose? Device → which physical unit is talking right now? Get those three right and everything else — MQTT, dashboards, history, automation — follows naturally. [image: 1794556164826-01-products.png] A product is the template. The card summarises how many devices use it and how many data points it defines. Product: the schema, not the hardware A product is a template for a class of device. It is not a physical unit and it does not connect to the broker by itself. A product holds: a name, description, and icon, the list of data points that every device of this type must expose, product-level metadata used by the UI and by templates. Think of it as the firmware interface description. If you are building a greenhouse controller, the product might be Greenhouse Controller v1. Every greenhouse controller you ship uses that same product, so every dashboard, alert, and history query works the same way. Create one product per hardware family. Do not create a product per unit. If two units differ only by serial number, they are devices of the same product. Data point: one named value in the contract A data point is one value the product exposes. It has: Field Purpose Example Name Human label Ambient Temperature Identifier (code) Machine key used in payloads temp Data type How the value is interpreted INT / BOOL / STR / JSON / RAW Direction Who writes the value Status / Control / Both Unit Display suffix °C Min / max / step Validation and widget bounds 0 / 60 / 0.1 Storage Whether history is retained on / off Two rules matter more than the rest: The identifier (dpcode) is the key your device publishes. It is not the numeric data point ID. The data type and direction are part of the contract. A dashboard widget that needs a boolean will not bind to a string point, and a control widget will not write to a status-only point. The product detail page lists every data point and shows the code, type, unit, and direction in one table. [image: 1794556165628-02-data-points.png] Data points define what a device can report or accept. The identifier becomes the key you publish in MQTT. Direction: status, control, or both Status (from device): the device reports it. Temperature, humidity, battery voltage, fault code. Control (to device): the dashboard or an automation writes it. Pump on/off, target temperature, mode selector. Both: the value can be reported and written. Use this for things like a setpoint that the device also echoes back. Direction is enforced by the UI and by the binding rules. If a widget cannot see a data point, check the direction before you check the network. Storage: live vs history A data point is live by default. Enable Storage when you need history for charts, exports, or audits. Storage is a per-data-point decision, so you can keep high-rate telemetry live-only and still retain daily totals. Device: one physical unit A device is one unit of a product. It has: a device UUID (used in the MQTT topic), a client ID / MQTT username and password, an optional owner assignment, a live connection state, a monitor view that renders the product's dashboard with real values. When you create a device, assign it to the product. The device then inherits the product's data point schema. If you add a data point later, every device of that product sees it; no per-device schema migration is needed. [image: 1794556166110-03-devices.png] A device is one physical unit. It inherits the product schema and gets its own MQTT client ID and password. Device ID vs client ID They are related but used in different places: The device UUID identifies the device in the topic: 1v0/<DEVICE_ID>/uplink. The client ID shown on the device card is the MQTT username. In the standard provisioning flow it is the same UUID. The password is generated with the device. It is a secret. If your account shows a client ID that differs from the device UUID, use the client ID as the MQTT username and the device UUID in the topic. The monitor is where the model becomes visible: the device's live state is rendered through the product's dashboard, using the bindings defined in UI Studio. [image: 1794556166654-04-monitor.png] The monitor is the runtime view: live values arrive over WebSocket as soon as the device publishes. A worked example Product: Greenhouse Controller v1 Code Name Type Direction Unit Storage temp Ambient Temperature INT Status °C on humidity Relative Humidity INT Status % on pump Pump State BOOL Both — off mode Operating Mode STR Both — off schedule Schedule JSON Both — off A device of this product publishes: { "type": 0, "stype": 0, "data": { "temp": 25.4, "humidity": 60, "pump": true }, "dir": 49 } The keys temp, humidity, and pump are the data point codes, not their numeric IDs. The server matches them to the product schema and updates the device's live state. The five mistakes to avoid Putting dpid in the payload. The payload uses dpcode. Numeric IDs are internal. Creating a product per unit. Create a product per hardware family, then add devices. Renaming a dpcode after deployment. It is a breaking change for every device and dashboard. Add a new point and migrate instead. Using a status-only point as a control. The widget will not bind, or the write will be rejected. Storing everything. High-rate telemetry can be live-only. Enable storage only where history is useful. What to read next Quickstart: Device → MQTT → Live Monitor for the exact topic, payload, credentials, and a runnable publisher. Data Point Types Explained for choosing the right type. Your First Dashboard in UI Studio for binding widgets to the data points you just defined.