🎨 Your First Dashboard in UI Studio
-
Your First Dashboard in UI Studio
UI Studio turns a product's data points into a mobile-style dashboard. No app build, no separate frontend project: you arrange widgets on a canvas, bind them to data points, and publish.
This guide builds a small greenhouse screen with three values and one control.

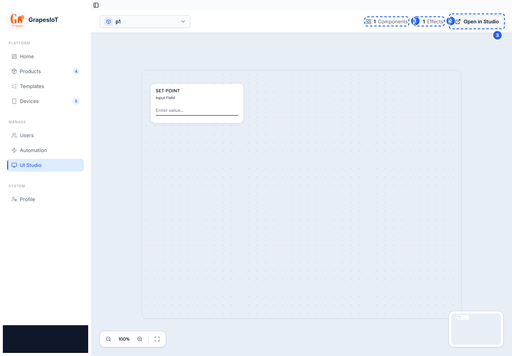
The UI Studio workspace previews a product dashboard and opens the full editor in a new tab.
Before you start
You need:
- a product with data points,
- at least one device assigned to that product,
- the device online or publishing (so you can see values move).
If you have not published a message yet, do the Quickstart: Device → MQTT → Live Monitor first. A dashboard with no data is hard to debug.
1. Open the studio
There are two entry points:
- From a product card: click UI Studio. This opens the studio for that product in a new tab.
- From the sidebar: open UI Studio, pick the product, then click Open in Studio.
The product-card route is the fastest way to start from scratch. The sidebar workspace shows the current dashboard and its component and effect counts.
2. Know the three areas
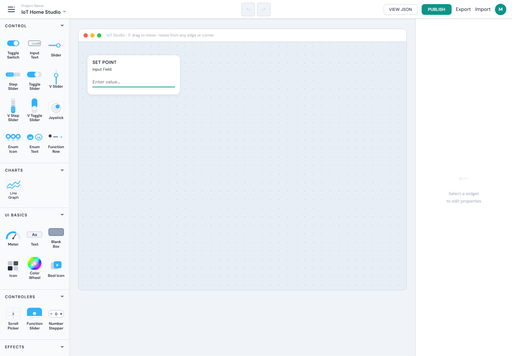
The studio has three working areas:
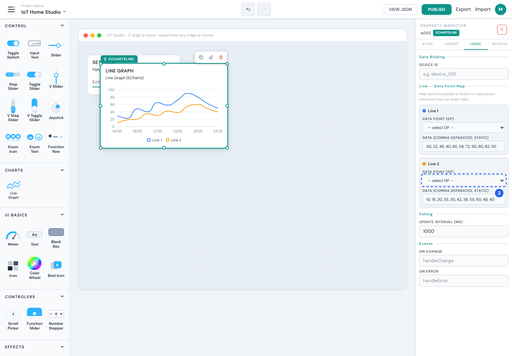
- Palette on the left: the widgets you can add.
- Canvas in the middle: a mobile-style surface at a fixed design width.
- Property panel on the right: the selected widget's settings.

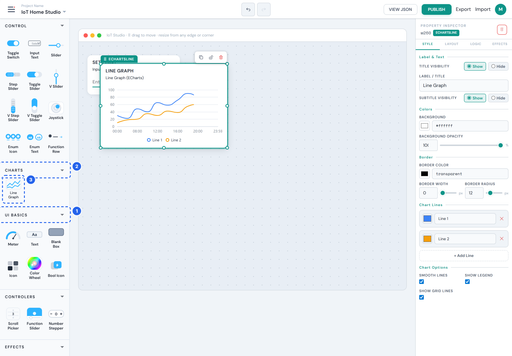
The palette groups widgets by job: controls, charts, UI basics, controllers, and effects.
The palette groups widgets by job. You will use these groups most often:
- CONTROL — toggles, sliders, input fields.
- CHARTS — line graphs and other history views.
- UI BASICS — text, meters, icons, shapes, colour pickers.
- CONTROLERS — scroll pickers, steppers, function sliders.
- EFFECTS — motion and other visual effects.
The exact list depends on your build. If a widget is missing, it may be a newer widget that is not enabled for your account.
3. Add widgets
Drag a widget from the palette onto the canvas, or click it to add it at a default position.
For the greenhouse screen:
Area Widget Bound data point Top Text none (title) Row 1 Value / Status tempRow 1 Value / Status humidityRow 2 Line Graph temp(history)Row 3 Toggle Switch pumpKeep the canvas focused. A dashboard that shows everything is harder to use than one that answers a single question.

The canvas is a mobile-style surface. Drag widgets from the palette, resize them, and bind each one to a data point.
4. Style and layout
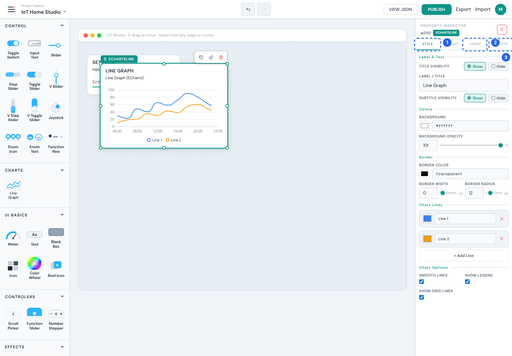
Select a widget to open the property panel. The tabs are:
Tab What it controls STYLE Colors, typography, borders, backgrounds LAYOUT Position, size, alignment, spacing LOGIC Data binding and behaviour EFFECTS State-based visual changes 
Select a widget to edit its style, layout, logic and effects. Logic is where data binding lives.
Use LAYOUT to align widgets to a grid. The canvas is mobile-first; keep touch targets large enough to tap and avoid placing controls at the very edge.
5. Bind data
Open the LOGIC tab and find Data Binding.

Pick the device and data point in the Logic tab. The widget starts receiving live values as soon as the device publishes.
- Choose the device.
- Choose a data point.
- Confirm the widget supports that data point's type.
Binding rules to remember:
- A Status point can be read by a display widget.
- A Control point can be written by a toggle, slider, or button.
- A Both point can be read and written.
- A numeric widget will not bind to a string point, and a boolean widget will not bind to a number.
If the data point list is empty, the device may not be assigned to the product, or the product may not have compatible points.
For a line chart, bind history. If the data point does not have Storage enabled, there is no history to draw; the chart will be empty even though the live value updates.
6. Add effects (optional)
EFFECTS lets a widget change its appearance based on a value. Typical uses:
- turn a status tile red when temperature is above a threshold,
- change an icon when a pump is running,
- show a warning state when a battery is low.
Effects are evaluated on the client from live values. They are not server-side automations. Use the Automation section if you need to trigger an action rather than change a visual.
7. Publish
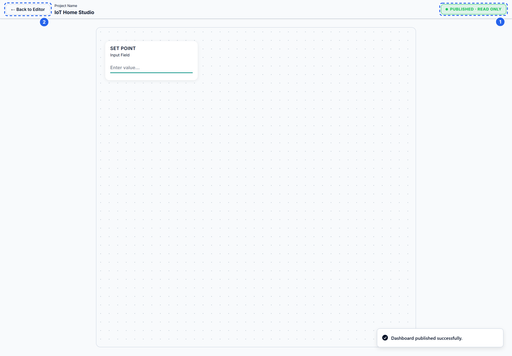
Click PUBLISH in the top bar. The current layout is frozen into a read-only screen.

PUBLISH freezes the current layout into a read-only screen that the device monitor and mobile clients can consume.
The published screen:
- appears in the UI list,
- can be opened in the studio for further editing,
- is what the device monitor renders,
- is read-only at runtime, so users cannot accidentally move widgets.
Publishing does not deploy firmware and does not change the data model. It only snapshots the layout and bindings.
8. Verify with live data
Open the device monitor and publish a message. Confirm:
- the connection pill reaches Live,
- each bound widget shows the expected value,
- the toggle writes a control message when tapped,
- the chart fills if history is enabled.
If a value is stale, check the binding first, then the payload key. A typo in
dpcodeis the most common cause of an empty widget.A good first-screen checklist
- One clear purpose per screen.
- A title that says what the screen is for.
- The three or four values that matter most, not every value in the product.
- Controls that are visually distinct from read-only values.
- Large touch targets and consistent spacing.
- A test with real data before you publish to users.
Common questions
Can I reuse a screen across devices?
Bindings are per widget. If devices share the same product and data point codes, you can copy the layout and change the device binding. Keep one screen per product family.Why is my chart empty?
The data point probably has Storage disabled, or the device has not published enough history yet.Why can't I bind a control?
The data point is probably Status only. Change it to Both or Control, or use a display widget instead.Does publishing affect the device?
No. Publishing only snapshots the dashboard. It does not send anything to the device.Next
- Data Point Types Explained for choosing the right widget and direction.
- Quickstart: Device → MQTT → Live Monitor for getting values into the platform.
Hello! It looks like you're interested in this conversation, but you don't have an account yet.
Getting fed up of having to scroll through the same posts each visit? When you register for an account, you'll always come back to exactly where you were before, and choose to be notified of new replies (either via email, or push notification). You'll also be able to save bookmarks and upvote posts to show your appreciation to other community members.
With your input, this post could be even better 💗
Register Login